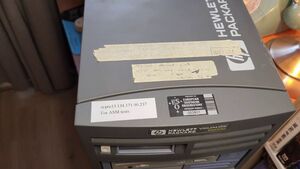
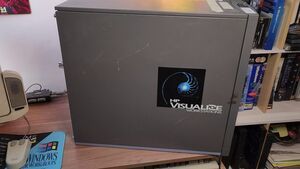
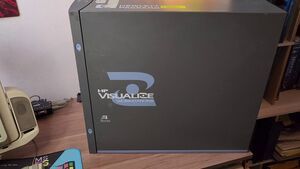
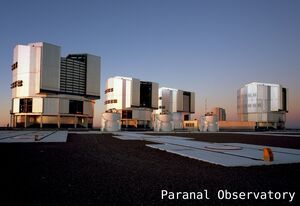
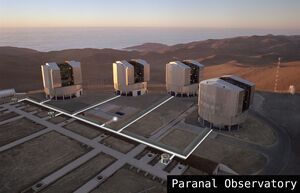
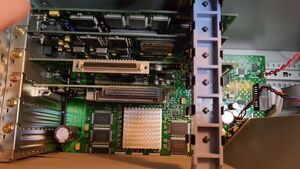
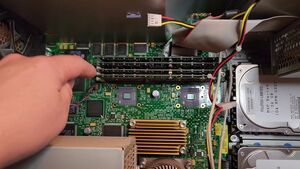
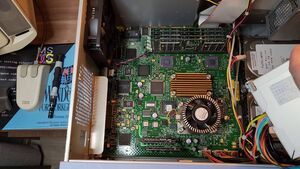
HP Visualize B2000 brought from the ESO observatoriesA friend of mine got this machine for me directly from the Paranal Observatory, which belongs to the ESO, the European Southern Observatory, located in Antofagasta in northern Chile, South America.
View all (10 images) Why a European observatory in South America?
Northern Chile boasts the clearest skies on the planet; consequently, in the mid-1960s, the European Union selected the region for its research centers, allocating 10% of observing time to Chilean astronomy.
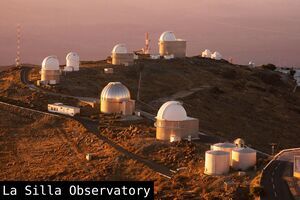
La Silla Observatory:
Inaugurated in 1969, this was ESO’s first major complex in the country. It housed over a dozen telescopes, including the NTT (a pioneer in active optics) and the 3.6-meter telescope, renowned for hosting the HARPS instrument—a key exoplanet hunter.
Cerro Paranal and the VLT:
In search of superior conditions, the summit of Cerro Paranal was blasted away in 1991 to construct the VLT (Very Large Telescope), which became operational around the year 2000. It consists of four main telescopes, each with an 8.2-meter aperture. Most impressively, they can combine their light via interferometry (VLTI), functioning as a single, virtual giant telescope with extremely high resolution.
View all (4 images) What was this computer doing at the observatory?
This computer was part of the first generation of hardware used to operate ESO's most powerful observatory. Specifically, it served the ASM (Astronomical Site Monitor)—a suite of instruments independent of the main telescopes that measure atmospheric conditions in real time.
This computer was responsible for analyzing weather data—such as air turbulence, wind, humidity, and sky transparency—and using complex calculations to select the moment with the best conditions for operating the VLT.
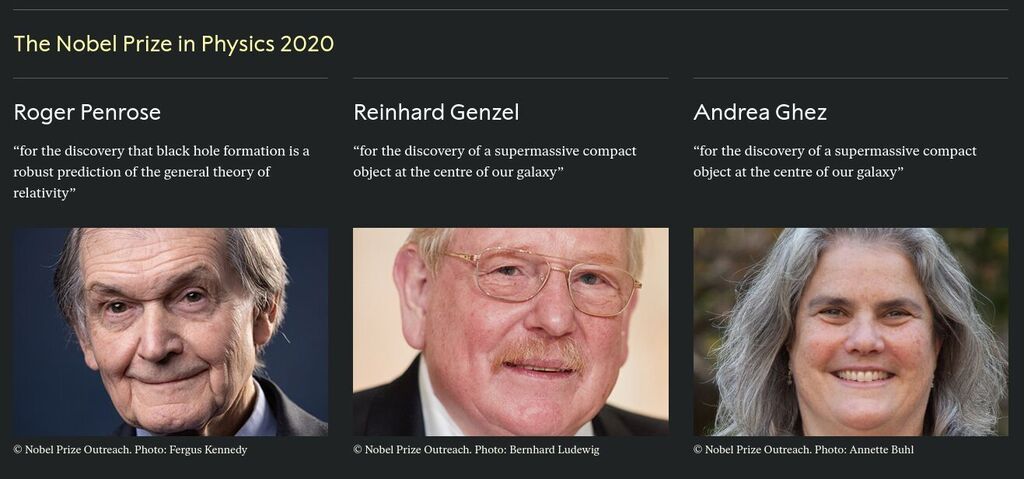
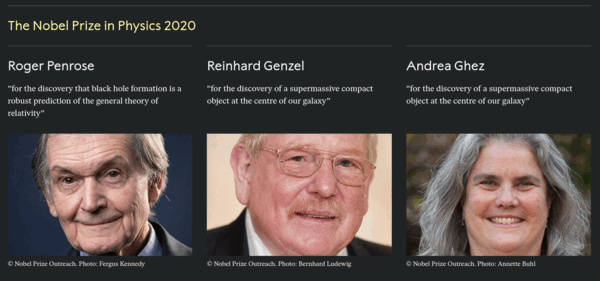
Important discoveries made while this computer was part of the observatory2020 Nobel Prize in Physics: Confirmation, through imaging of nearby stars, of the presence of a supermassive black hole at the center of the Milky Way (Sagittarius A*). The award was divided into two parts to recognize both the theoretical development and the observational confirmation:
1. Roger Penrose (1/2 of the prize)
The achievement: He mathematically demonstrated that the formation of black holes is a direct and robust consequence of Albert Einstein's General Theory of Relativity.
2. Reinhard Genzel and Andrea Ghez (shared the other half)
The achievement: They discovered an invisible, supermassive compact object at the center of our galaxy, the Milky Way.
The context: Since the early 1990s, both scientists led independent groups of astronomers (Genzel using telescopes in Chile and Ghez using the Keck telescopes in Hawaii) to map the orbits of stars near the galactic center (a region known as Sagittarius A*).
They developed advanced optical techniques to correct for distortions caused by Earth's atmosphere. By measuring the speed and orbits of these stars over decades, they demonstrated that a mass equivalent to 4 million suns is concentrated in a region no larger than our solar system. The only explanation known to current physics for such density is a supermassive black hole.
|
|
|
|
|
Year 2004: The first photograph of an exoplanet (2M1207b) was captured.
Years 2002–2005: Gamma-ray bursts (GRBs). The VLT demonstrated that long-duration gamma-ray bursts are directly linked to the explosions of hypermassive supernovae and the collapse of dying stars into black holes. Year 2007: The age of the star HE 1523-0901 was measured using a "radioactive clock" based on the decay of uranium and thorium, estimating its age at approximately 13.2 billion years (almost as old as the universe itself).
HP Visualize B2000 Specifications
The HP Visualize line was created in response to the market for high-performance desktop machines, such as those from Sun SPARC, Silicon Graphics, and NeXT Computer. These systems were primarily used in scientific and industrial fields, as they supported high-resolution displays and featured powerful graphics circuitry capable of simulating three-dimensional environments, as well as high-speed SCSI interfaces.
| Processor | HP PA-8500 64-bit 400 MHz |
| L1 Cache | 1.5 MB |
| RAM | 1 GB (four 256 MB modules) |
| Integrated graphics card | HP Visualize Fxe A4982A, 18 MB VRAM |
| Additional PCI graphics card | HP Visualize Fxe A4982A, 18 MB VRAM |
| Storage | 2 x Fujitsu 36 GB HDD, Ultra 320 SCSI, 10,000 RPM |
| Network | Integrated 10/100 Base-T Ethernet port |
| Additional network card | FORE PCI-X 64-bit Optical ATM |
| Additional SCSI card | Ultra Wide SCSI |
| Additional SCSI card | Ultra2 SCSI LVD |
| CD-ROM drive | Mitsumi |
| Operating System | HP-UX 11.0 (Unix) |
View all (21 images) Reset the root user password
As with any Unix or Linux system, you can easily reset the password if you have physical access to the machine.
The steps are as follows:
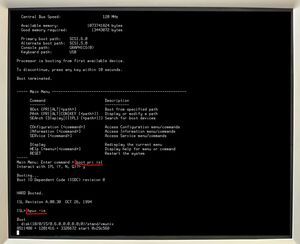
1) Reboot the machine.
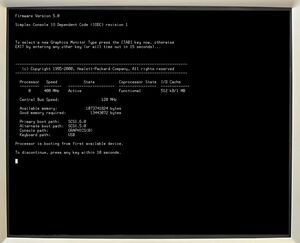
2) Interrupt the boot process by pressing a key.
3) Now enter these commands:
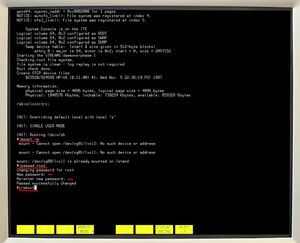
boot pri isl
hpux -is
4) Now that you are logged in as root, mount the hard drive and change the password.
mount -a
passwd root
- enter the new password twice
reboot
View all (6 images)
Hard drive data analysis
After I reset the administrator password and checked the system users, I was shocked. I found a large collection of software developed for the observatory.
But that wasn't all. Most of these programs also include their source code, that means we can understand how they work and even create mock versions that can run outside the observatory network.
I connected the machine to my home network, and to my surprise, it already had FTP and Telnet services set up, that made it very easy to copy the files to my PC and study them more easily in my free time.
Based on my research, I believe this machine was used at two observatories, it was first at Paranal until 2004, its hard drives were removed, and shortly after that it was sent to La Silla Observatory as a spare machine for TIMMI. TIMMI stands for Thermal Infrared Multimode Instrument. It is a thermal infrared camera and spectrograph that lets us see light invisible to the human eye.
On June 13th 2004, it received the hard drives it currently has, there is a fifteen-day gap close to the date shown on the case labels-drives that perhaps used to be part of another machine.
Well, after a month of analysis, I wrote down everything needed to run this software. I created a few scripts that allowed me to set up and emulate services and connections. To display the data on the user interfaces, I restored part of the data found from 2007.
|
|
|
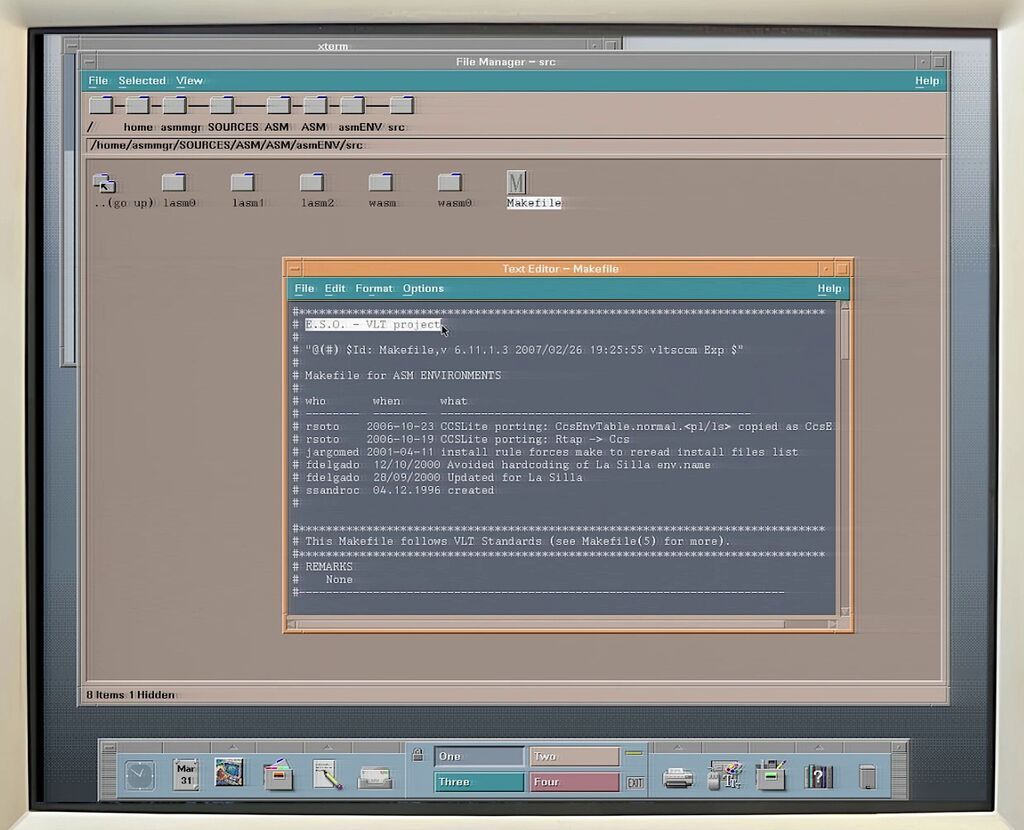
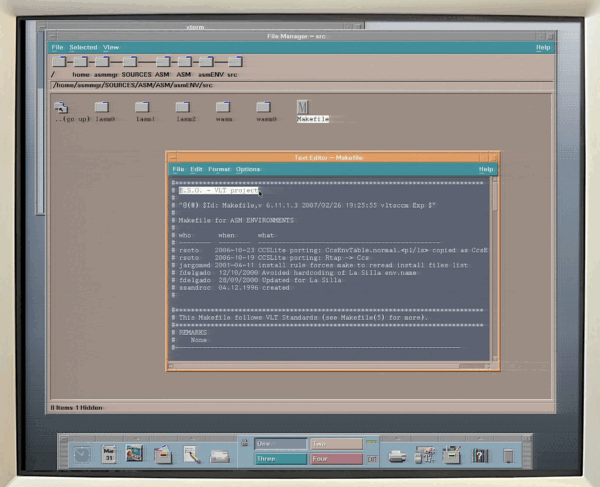
ESO VLT Source code example
|
|
Observatory software examples:
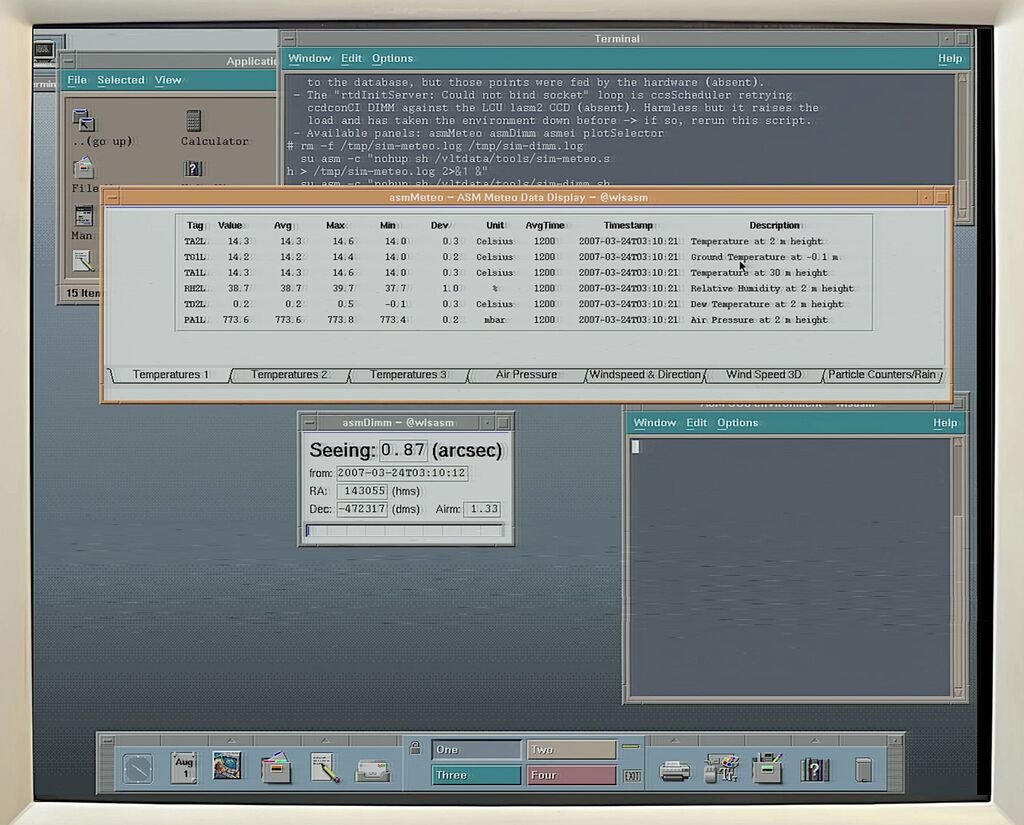
Here is the ASM meteorology panel (tabs: temperatures, pressure, wind...), likely the most important software on this machine, as it enabled the monitoring and planning of telescope operations.
asmMeteo ("ASM Meteo Data Display") is the meteorology panel for the La Silla Astronomical Site Monitor. The panel does not read directly from the weather station; instead, it displays data from the online database of the wlsasm CCS environment. At the observatory, that data was written by the hardware via the LCUs and asmmetTransfer.
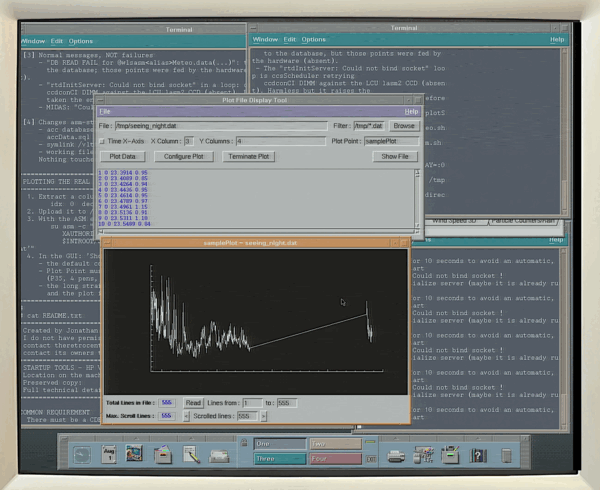
The asmDIMM is the seeing monitor (DIMM). "Seeing" measures the extent to which the atmosphere blurs a star's image, and the DIMM calculates this by observing a single star through two apertures and measuring the fluctuations in the distance between the two resulting points. Drawing data from additional detectors, this was the crucial tool for deciding whether to operate the VLT.
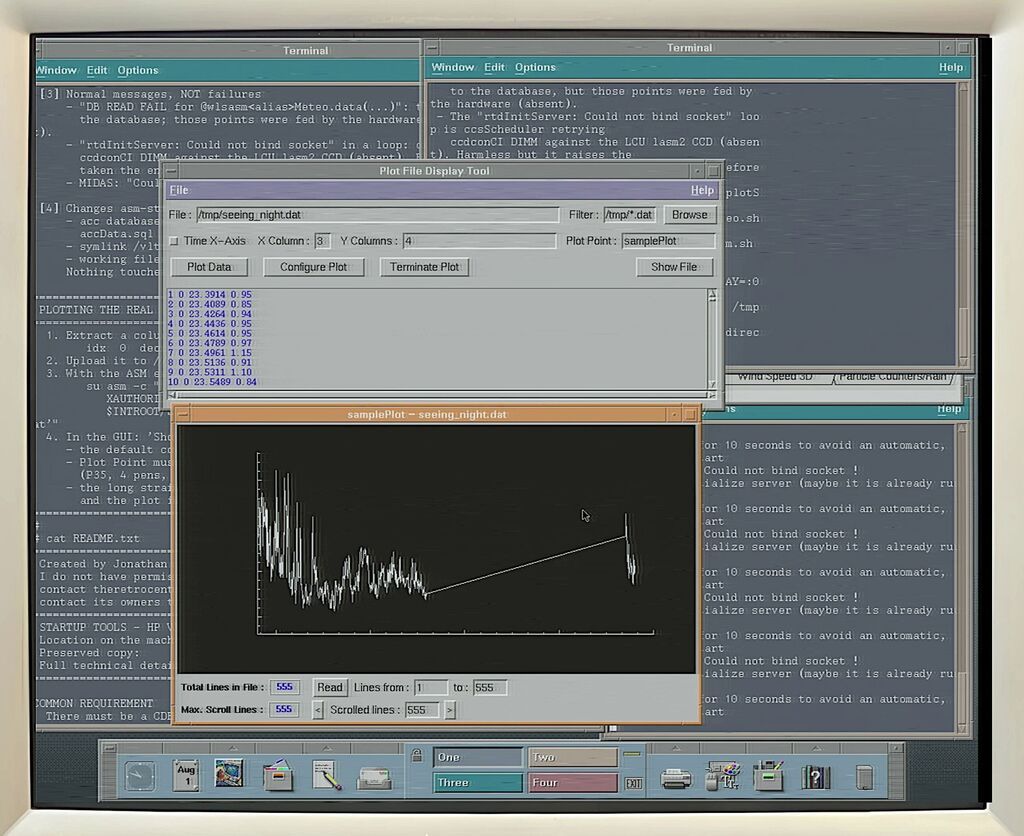
Next is the Plot File display; this tool plots time series based on data files from the site monitor. It is used to display the seeing curve, serving as a supplement to the aforementioned monitor.
The graph shown in the image represents the actual seeing at La Silla on the night of March 19–20, 2007: 555 measurements, with a minimum of 0.37″, a maximum of 1.37″, and an average of 0.64″.
|
|
|
|
|
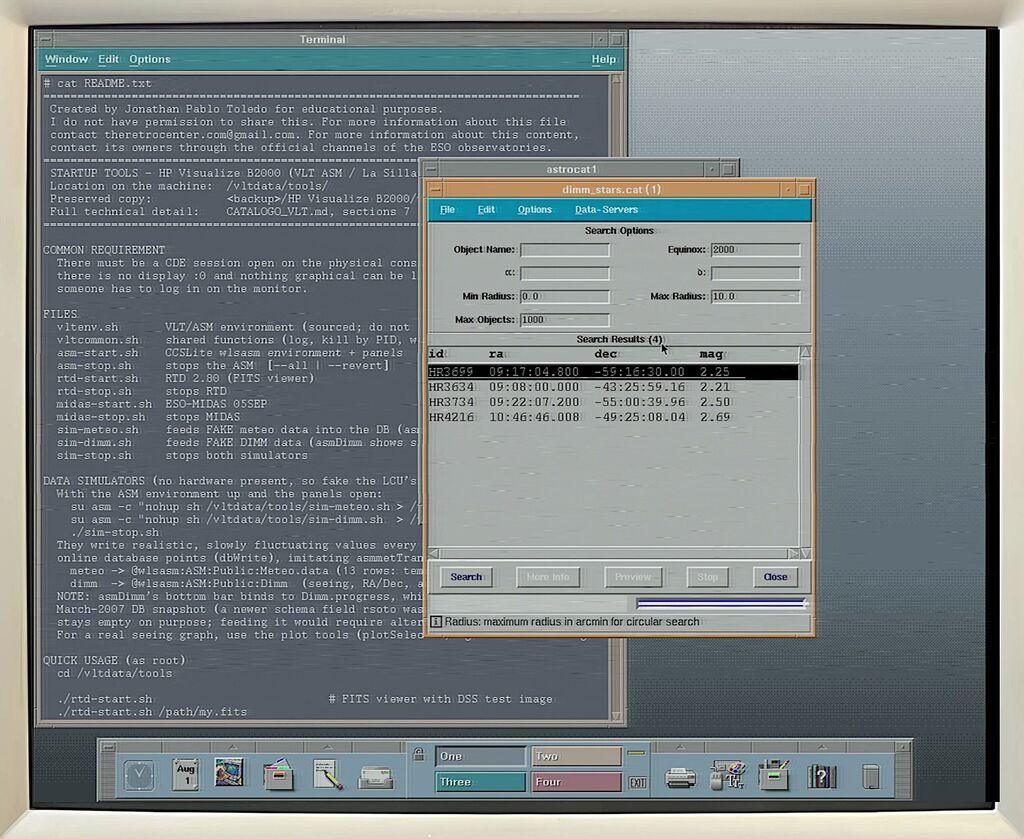
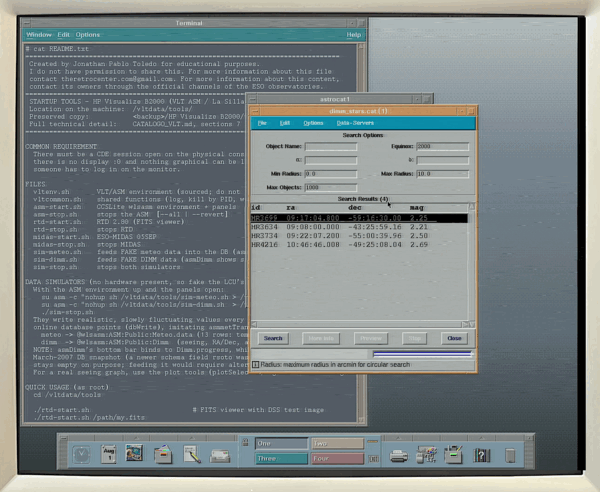
Then there was Astrocat: a tool for browsing astronomical catalogs of stars and celestial objects and overlaying them onto images—using catalogs from ESO, CDS, and other sources. It searches by position (RA/Dec) and radius, returning a table containing IDs, coordinates, magnitudes, etc.
It also opens local catalogs in the Skycat table format: tab-separated text with a header row and a separator line (`-- --`).
At the observatory, it was used, for instance, to search for guide or reference stars. In the context of the ASM, it was used for the stars targeted by the DIMM (seeing monitor).
An analysis of the hard drive data reveals information on four real stars targeted by the DIMM on its final night (March 23, 2007): HR3699, HR3634, HR3734, and HR4216. These are magnitude ~2 stars located in the constellations Vela, Carina, and Centaurus. The data was extracted from the machine's own `dimm.log` file. These are the same stars whose scintillation produced the seeing curve displayed by `plotFileDisplay`.
|
|
|
|
|
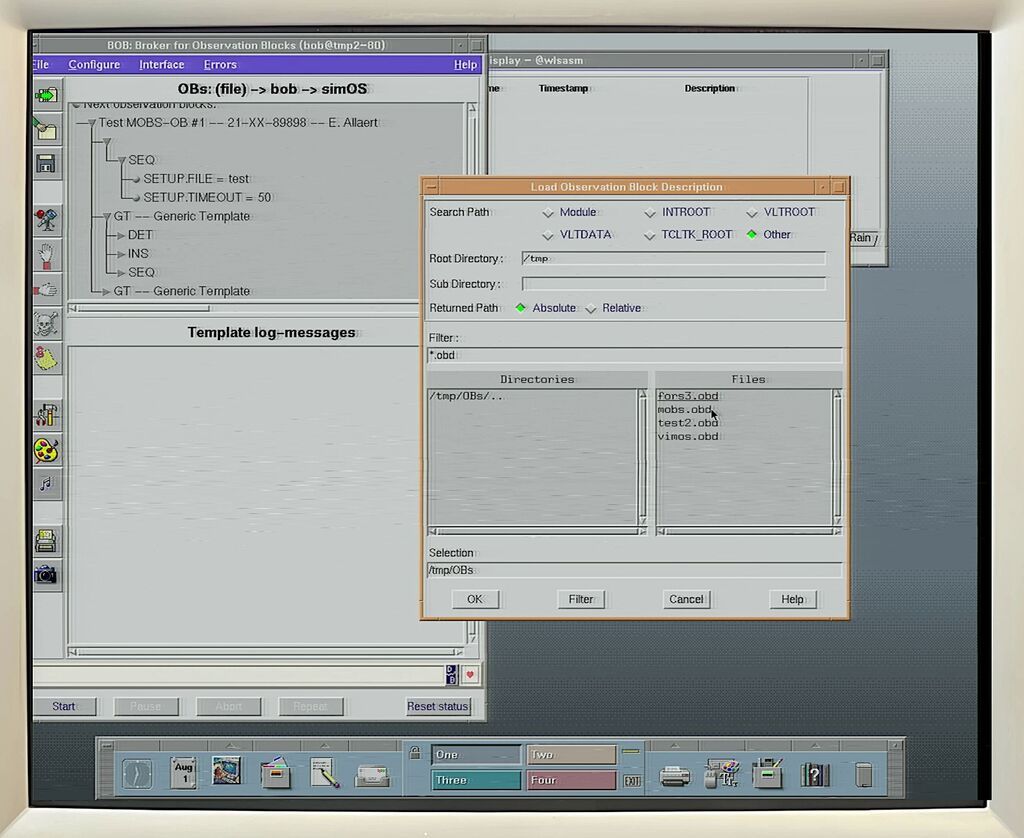
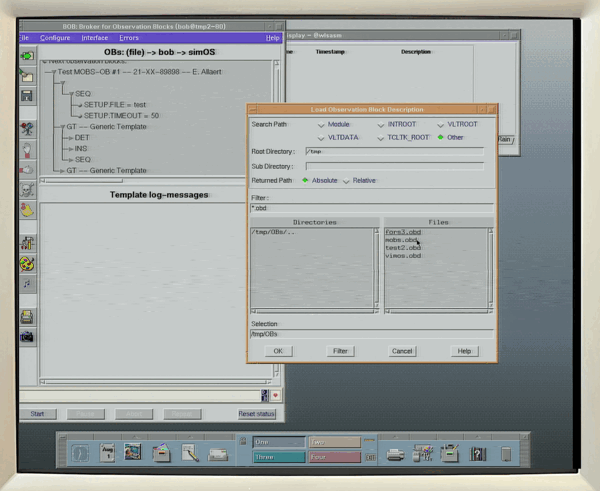
Next is BOB: this tool is a VLT observation sequencer; it is used to create execution scripts for the instruments.
|
|
|
|
|
- The astronomer prepares an Observation Block (OB) using the P2PP tool. The OB is a .obd file in PAF format. It contains the target, the templates (acquisition, science, calibration), and their parameters: exposure times, filters, offsets, etc.
- BOB loads this OB and displays it to the operator via a Tcl/Tk GUI. The list of templates and their parameters is visible and can be edited prior to execution.
- Upon execution, BOB runs the templates one after another. Each template is a sequencer script (written in Tcl, using the SEQ package). These scripts send commands via CCS to the telescope control system, the instrument, and the detector.
- The operator monitors progress and has the ability to pause, resume, skip, or abort templates.
In short, BOB is the layer that translates "what the astronomer wants to observe" into the sequence of commands that drives the telescope and the instrument.
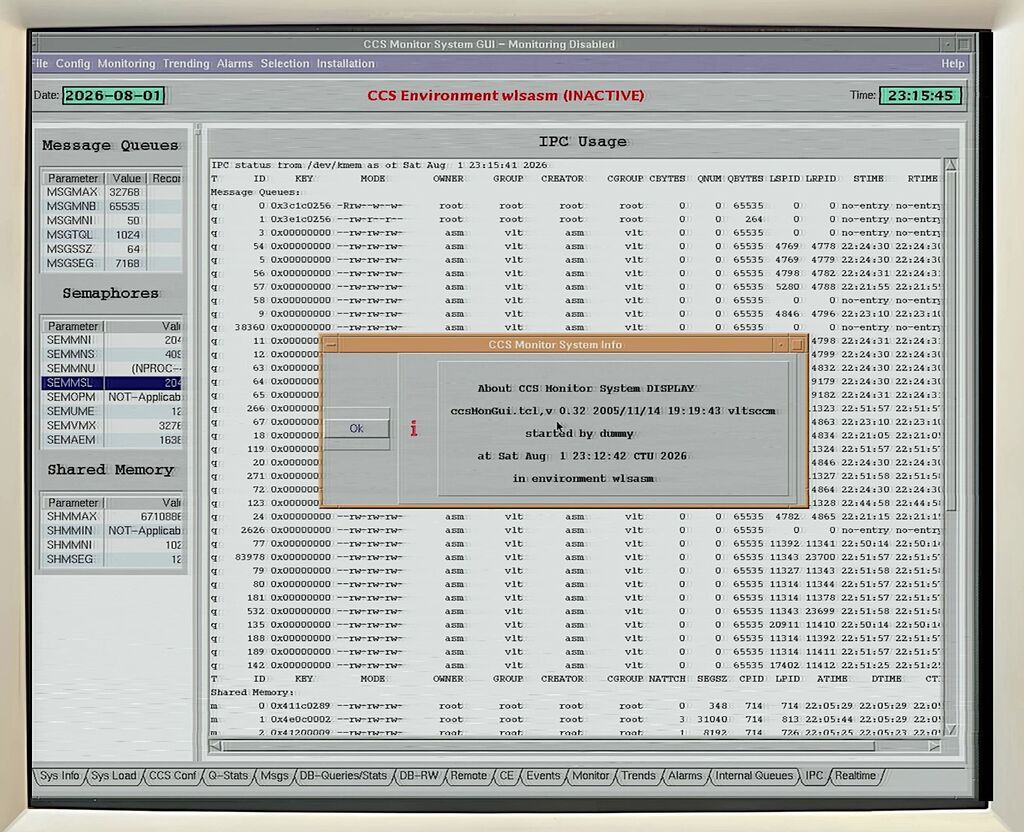
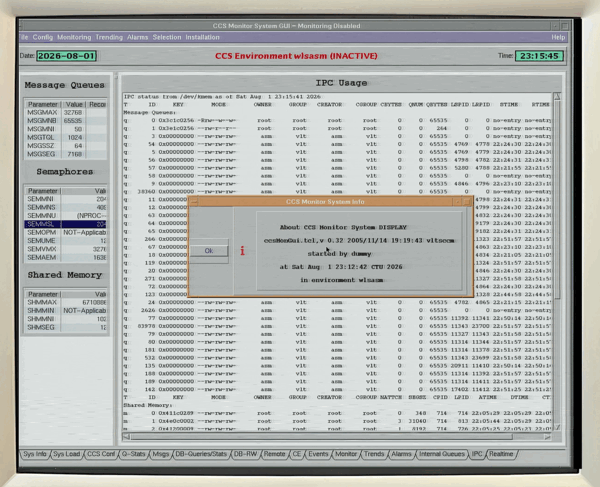
The following tool is called ccsMonGui: It is a system monitor responsible for overseeing the observatory's entire software suite. It is useful because it provides a graphical view of system status, eliminating the need to enter commands into the terminal.
It runs a "CCS environment," which consists of a set of communicating processes:
- The online database, including its queues and shared memory;
- The message manager (msgServer, cmdManager);
- Alarms, logging, scanning functions, etc.
This environment diagnostic tool displays the amount of shared memory and system resources (queues, semaphores, database tables) currently in use. It helps detect whether the environment is running low on resources or if a specific process is consuming excessive memory.
|
|
|
|
|
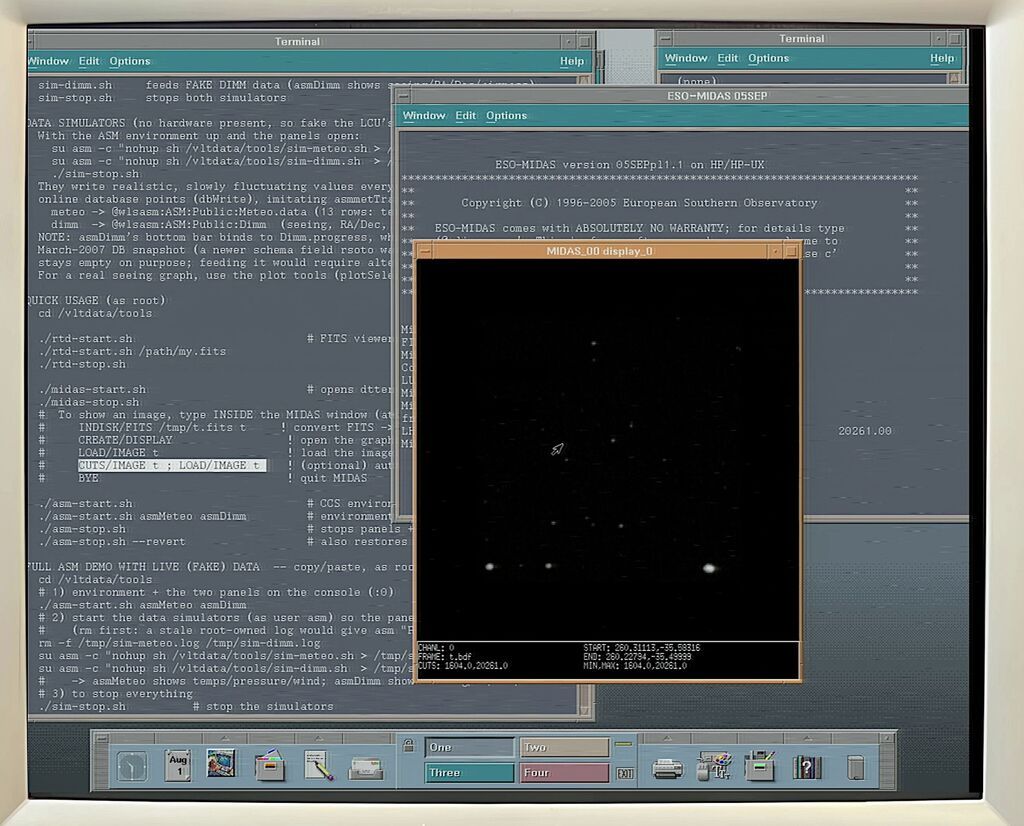
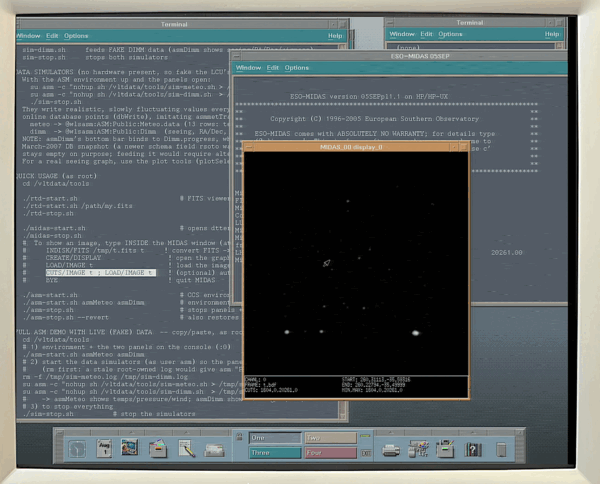
The software known as ESO-MIDAS (Munich Image Data Analysis System) is ESO's classic package for processing and analyzing astronomical data-specifically images, spectra, and tables. It operates via a command-line interpreter using COMMAND/QUALIFIER-style instructions and custom scripts (.prg procedures). It features graphical windows for viewing images and plotting graphs. It served as the standard data reduction tool at ESO from the 1980s through the 2000s, prior to the widespread adoption of IRAF and Python.
Within MIDAS, to view an image:
| Command |
Explanation |
| INDISK/FITS /tmp/t.fits t | Convierte FITS -> formato MIDAS (t.bdf) |
| CREATE/DISPLAY | Open the display window |
| LOAD/IMAGE t | Load the image |
| CUTS/IMAGE t ; LOAD/IMAGE t | (Optional) Auto-contrast if it looks flat |
| BYE | Exit |
|
|
|
|
|
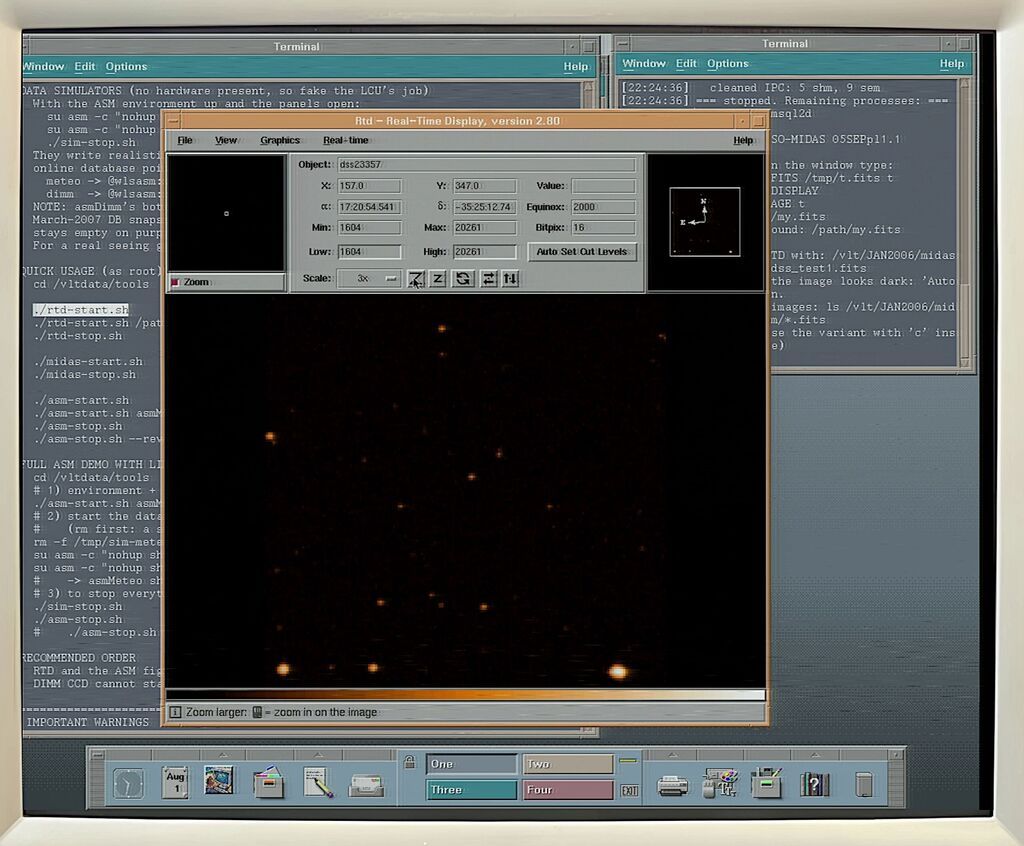
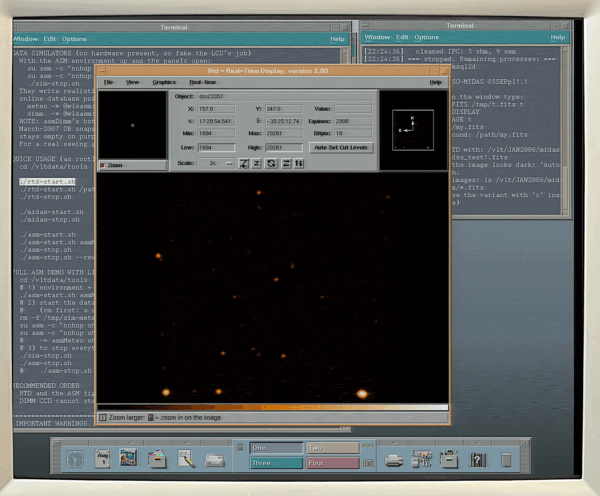
The following tool is RTD (Real Time Display), the VLT's image viewer. It is used to view live data captured by the detectors (CCD and infrared) and also serves as a standard FITS file viewer.
It is built using Tcl/Tk and is based on the rtdimage widget. This is the same foundation used for Skycat (and, consequently, Astrocat).
During operation, the detector control software places each frame into shared memory. A server process—rtdServer/rtdInitServer—notifies RTD, which immediately updates the image. This allows the operator to view each exposure as it comes off the detector.
Typical functions include:- zooming and panning, with panner and magnifier windows;
- intensity scaling and colormaps;
- pixel value table;
- sky coordinates (RA/Dec) overlaid on the image;
- cross-sections and profiles;
- statistics for specific image regions.
|
|
|
|
|
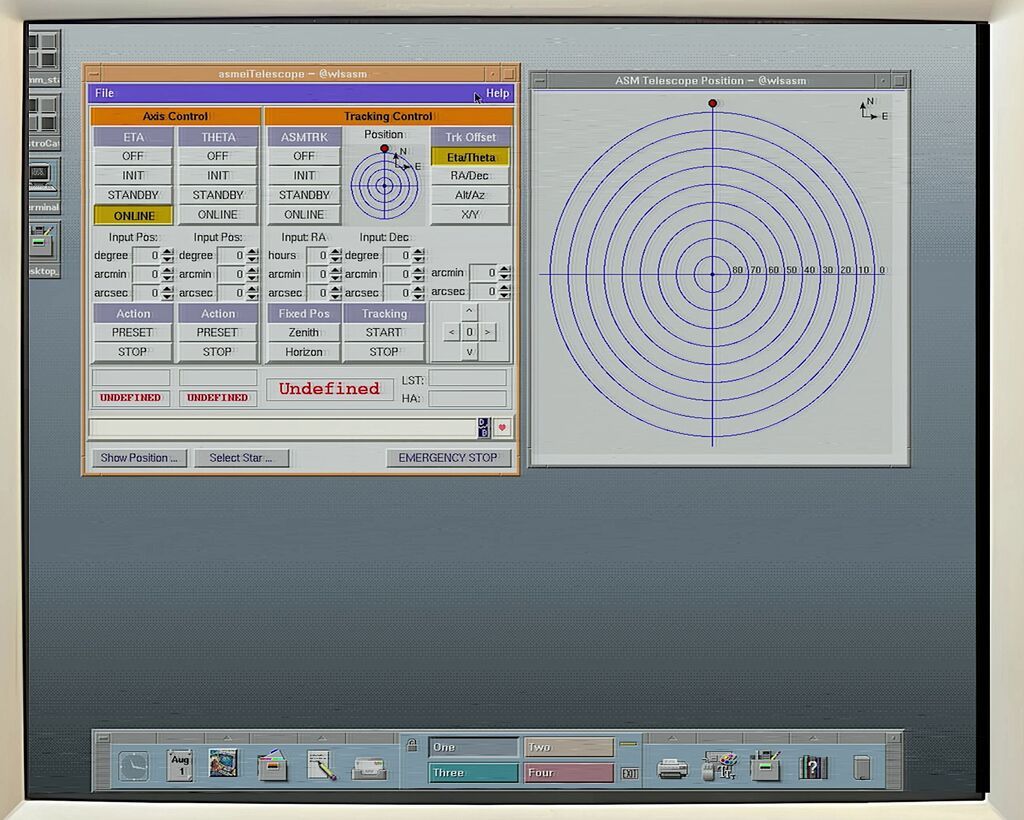
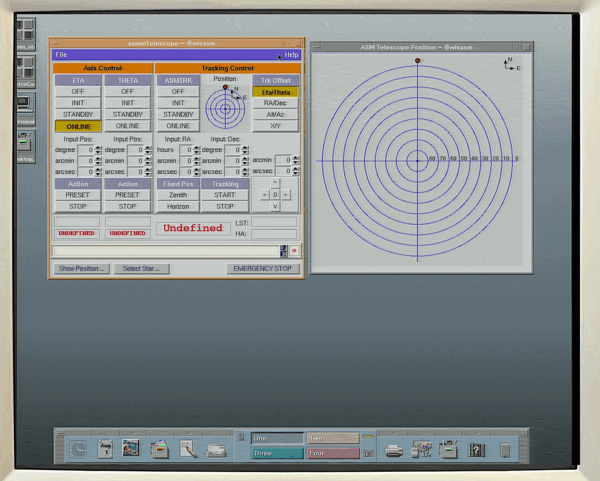
Another notable piece of software is asmeiTelescope, a control panel for the ASM's small telescope-the one that uses the DIMM to measure seeing. It does not control any of the observatory's large telescopes. It is accompanied by asmeiTelescopePosDisplay, which graphically shows where the telescope is pointing. Both are part of the asmei module, the ASM user interface. - Axis Control: moves the mount's two axes eta and theta independently. It accepts absolute or relative position inputs.
- Tracking Control: allows entering a target in RA/Dec, activating tracking, and applying offsets using an arrow-key pad (^ < 0 > v).
- Select Star…: opens a selector based on the ASM star catalog (asmcat module) and sends the chosen RA/Dec coordinates to the telescope.
- Show Position…: opens the position panel.
- EMERGENCY STOP: sends `msgSend lasm1 etaServer STOP` and `thetaServer STOP` commands. It halts both axes directly at the lasm1 LCU (the VxWorks computer that controlled the mount).
asmeiTelescopePosDisplay ("ASM Telescope Position") This is a circular sky map with North and East marked. It displays: - The telescope, showing both its actual position and its commanded position;
- The Moon, including its phase (it does not appear if below the horizon);
- A wind arrow that changes color: green, yellow (above 12 m/s), and red (above 18 m/s);
- A humidity indicator.
It was written at ESO between 1996 and 1997 (by mcomin, awalland, and ssandroc). The comment "calibrated moon and wind (I hope)" comes from the original code.
|
|
|
|
|
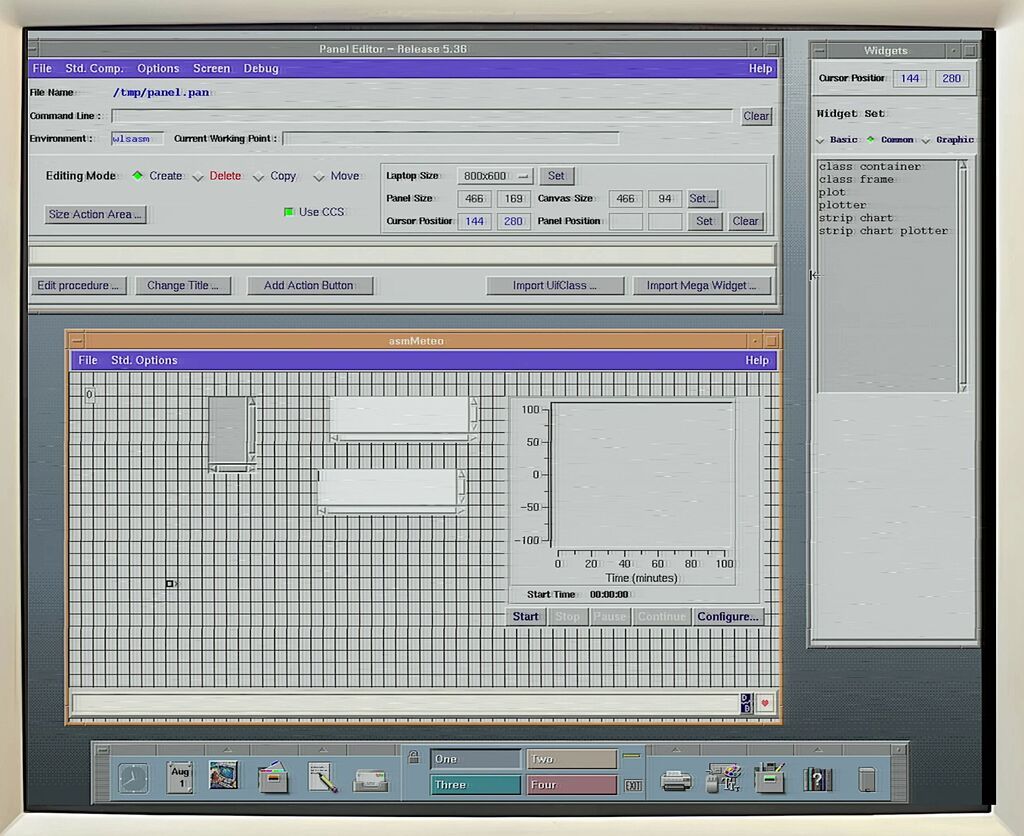
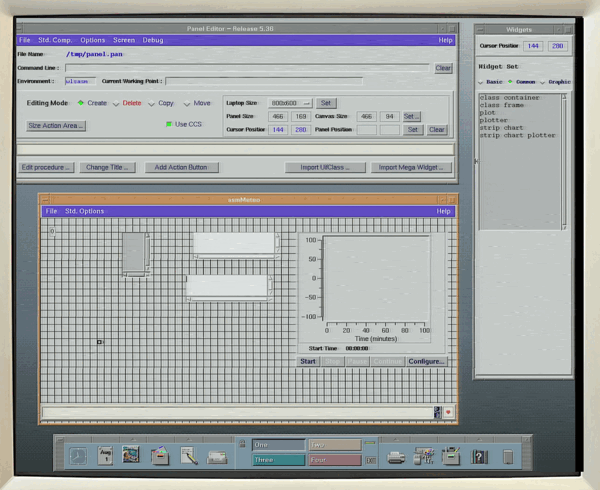
Finally, "Panel" is the VLT's graphical panel editor. It was used to design the observatory's operation interfaces: buttons, tables, fields, and widgets were placed on a canvas via drag-and-drop and linked to the CCS online database. All the ASM panels we have seen (asmMeteo, asmDimm, asmeiTelescope, etc.) were created using this tool.
- It was developed by ESO. It is a module of the VLT Common Software, version 5.36 (February 2006). ESO authors appear in the ChangeLogs—for example, "mcomin 27/02/96 Porting to TK4.0."
- It uses its own libraries: libpanPublic.tcl, libpanPrivate.tcl, and libasmUif.
- It is built upon free software: Tcl/Tk (the seqWish interpreter), [incr Tcl], and iwidgets. This follows the same pattern as the rest of the VLTSW: an open-source foundation with ESO's work layered on top.
How it works:- The editor saves each panel as a .pan file, which consists of automatically generated Tcl code.
- It includes the header "DO NOT MANUALLY EDIT THIS FILE" and the version of the editor used to create it. For instance, asmeiTelescope.pan reads "panel.tcl v4.4, 1998".
- The .pan file is installed as an executable launched via seqWish. It contains:
- Widgets and their coordinates; - The menu bar;
- Action buttons;
- Links to database points;
- user procedures (Init, Exit, callbacks). - The same file is used both to run the panel and to reopen it in the editor. The EDITING variable determines the startup mode.
|
|
|
|
|
Running applications and games on the HP Visualize B2000
I’d like to share these two websites that helped me find documentation and guidelines for the operating system.
This site doesn't offer downloadable content, but it’s incredibly helpful for understanding the machine architecture, directory structure, services, and so on.
And this other site was useful for downloading software; there’s a lot of content available here-including source code, and I got several libraries from it to compile some games and programs.
http://hpux.connect.org.uk/
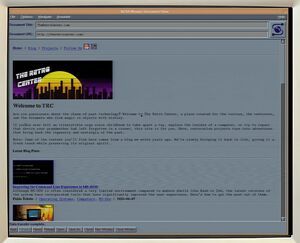
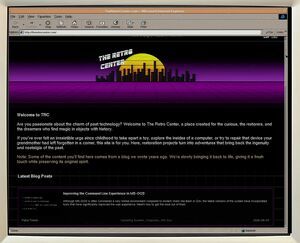
Since the machine has internet access, I went ahead and installed NCSA Mosaic 2.0 and Internet Explorer 5 to see if my retro-compatible website works correctly.
|
 |  |
|
Here is a list of games I have compiled and run:
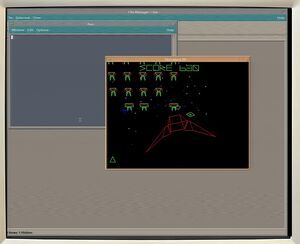
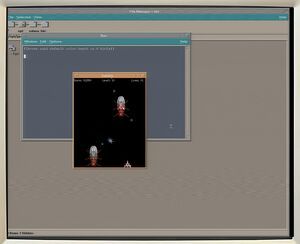
The first is highly iconic: *MazeWar*. Dating back to 1973, it is considered the first open-source 3D multiplayer shooter in history. It was ported to Unix decades ago; despite its simple visuals, there is a rich history behind this game.
The following games are ports for this platform: *Xinvaders 3D*, *Galaxa*, *SimCity*, *Doom*, and *Quake* (the last two ported by me).
View all (6 images) Conclusión
This review of the HP Visualize B2000 isn't just about restoring an ordinary computer-though, fortunately, this 1998 machine was running flawlessly. It is about recognizing the value of something destined for the scrap heap; were it not for the person who got this machine into my hands and saw its worth, it would have ended up at a recycling center, slated for destruction. I am incredibly proud to have saved such a significant piece of research history-hardware that helped capture key moments in the operation of the planet's largest telescope, ultimately enabling the confirmation of a supermassive black hole.
Preserving this kind of hardware and software isn't about nostalgia. It is the only way to ensure that the work of those who monitored the night skies from the La Silla and Paranal observatories remains accessible, rather than becoming nothing more than a hard drive that no one knows how to power up anymore.
And, as always, there is a YouTube video summarizing the entire process.
Comments (1)
Antonio-33 (user-1)   2026-10-29 13:15
Hello, I'm Antonio. I've worked on projects with Telescopic, and the software caught my eye. I currently have several parts motorized—could it be adapted for a controller in a small, home-built observatory?
TRC Admin  (Administrator) 2026-10-30 15:06
Hello Antonio, to be honest, I think this system is too complex to adapt for a homemade telescope. Even with the source code, it would require a great many changes; these systems are programmed for the ESO’s global network and, furthermore, they handle data from very specific detectors and controllers. Perhaps I could show you how they work, and then you could design your own, much simpler, custom software.
|
|
|